
In fact, not all people perceive textual information – most prefer when it is visualized. Therefore, if you want to specify some data or statistics in your next WordPress post, wouldn’t it be better to visualize it directly in your WordPress console?
Creating graphs, maps, charts, and other infographics can take a long time. But the process can be accelerated if you use special data visualization tools that have everything you need to quickly and effortlessly create beautiful and informative illustrations.
With these top tools for data visualization in WordPress, you can add tons of cool visualized data to your WordPress site very easily. Use them to make it easier to understand the statistics you provide.
Visualizer: Tables and Charts Manager for WordPress (Lite)
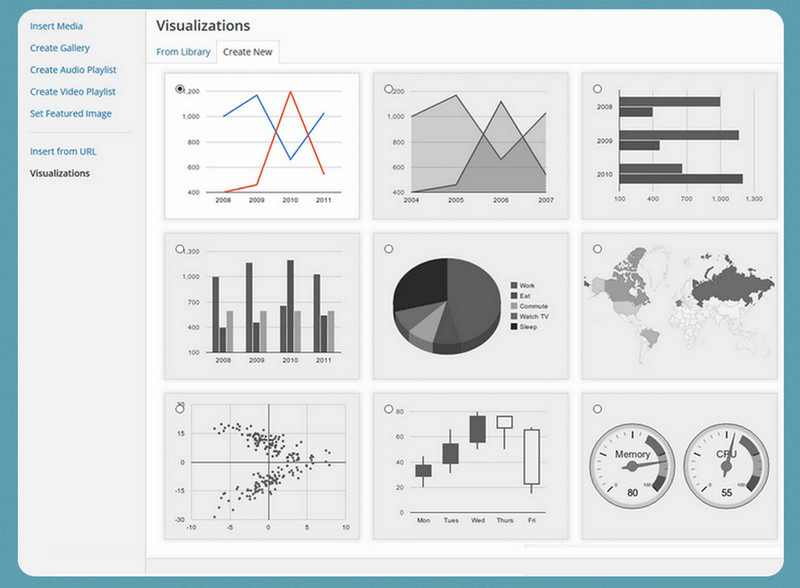
The plugin is a free module with paid add-ons. In the free version, you have 9 options of diagrams generated via HTML5 for cross-browser display. You can customize the appearance of the diagrams in detail so that they look perfect on your website.
Now you do not need to enter data manually, you can import it directly from a CSV file or even from Google Sheets.
In the premium version, you can import data from other diagrams and edit them in the online editor, but the functionality of the free version will satisfy the majority of users.
Data Tables Generator by Supsystic
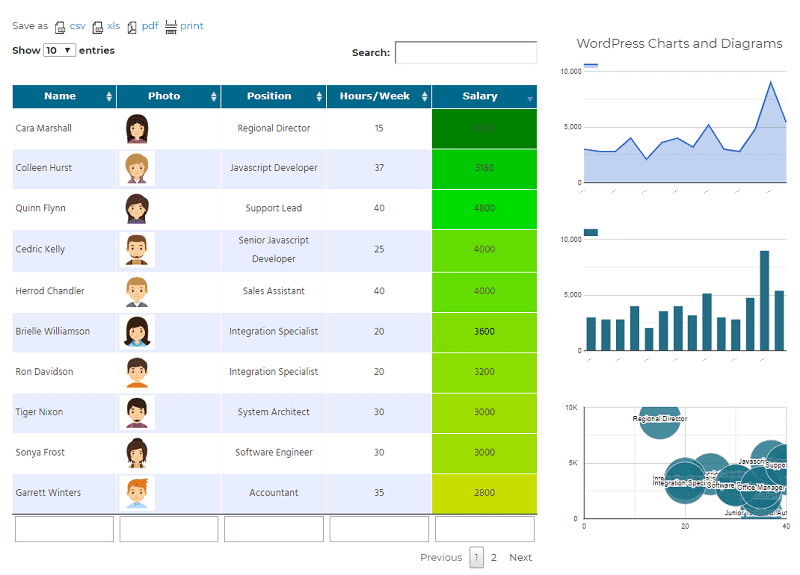
The plugin gives you the ability to create interactive tables, which can be turned into charts or graphs. This is a wonderful plugin with over 30,000 downloads and a 4.9 rating.
In an Excel-like interface, it is very easy to create tables. You can preview them before publishing to know exactly how they will look.
In addition, you can turn these tables into all sorts of graphs and charts. However, this feature is paid. You need to purchase a premium version.
If you need the ability to edit your spreadsheets right in the WordPress interface before making charts or graphs of them, then definitely choose this plugin.
Google Analytics
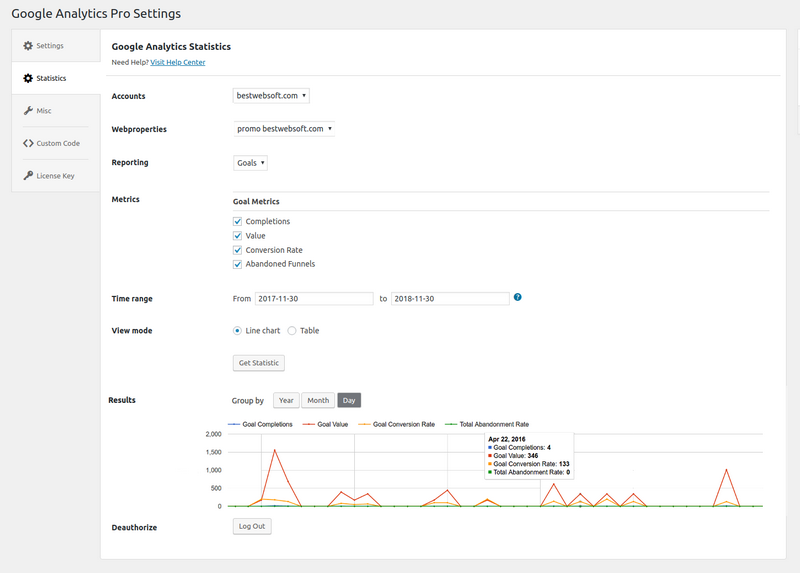
Google Analytics plugin is a great tool to view Google Analytics on your WordPress website dashboard. It allows you to select the metrics you need, set the time range for your statistic displaying and keep tracking the statistics.
With this tool, you can select a mode for viewing statistics as a line chart or table. Then you can choose statistics metrics such as visitor (unique visitors and new visits), session (visits, bounce rate, and average visit duration), or page tracking (pageviews and page/visit). A great feature is the ability to choose goal metrics (completions, value, conversion rate, abandoned funnels).
All these will help you analyze data to understand your website performance, increase your sales, and give your customers what they want to have.
WP Business Intelligence Lite
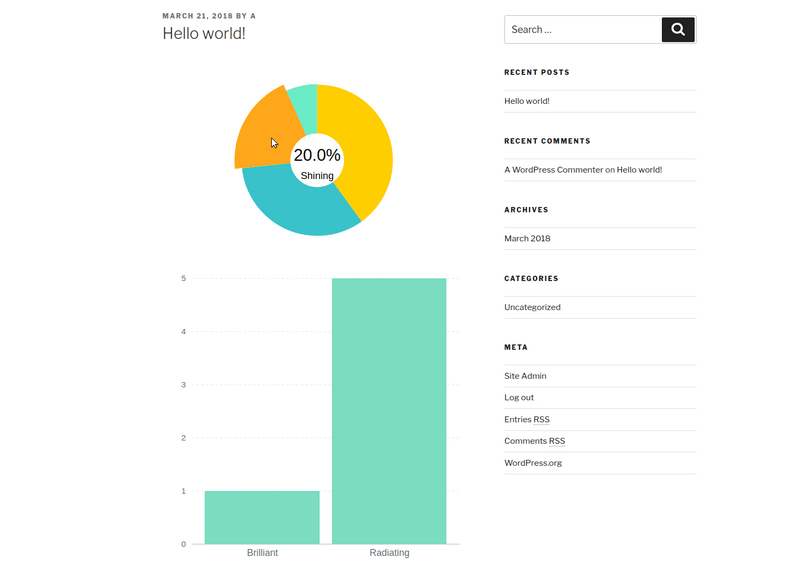
This plugin allows you to show your data in real-time charts and graphs on your site.
You can create SQL queries in the admin panel that retrieve real-time information from your database. Each time you view your page, the user will see the latest data.
WP Business Intelligence Lite is a perfect plugin for those people who create real-time data transfer. The premium version is quite expensive, but if you want to have access to all the advantages of the plugin, you have to pay.
Wrapping Up
Charts and graphs have always been a great way to help people see large amounts of data right away. Therefore, even if WordPress does not offer built-in graphing functions, there are many plugins that can display them on your site. So, if you want to find the best option for yourself, just try to use the above-mentioned tools in practice and evaluate all their main functions.